Top CCK-8 Assay Kits for Cell Viability Testing
Cell viability measurements can look simple: add reagent, wait, read absorbance. In practice, small choices can shift the result. Cck-8 kits use a water-soluble tetrazolium reagent that living cells reduce, producing a color signal commonly measured near 450 nm. The signal is useful, but it is not a direct cell count. Cell type, seeding density, incubation time, and treatment conditions all matter. A bright well is not automatically a healthy culture.
This guide compares top Cck-8 assay kits through practical criteria: reagent stability, workflow clarity, available formats, technical documentation, and suitability for common plate-based experiments. It also considers whether suppliers provide clear handling instructions and support for interpreting results. Look for a kit that matches the experiment, not simply the one with the strongest marketing claim. Include blank wells, untreated controls, and replicate measurements, then confirm that readings remain within the instrument’s linear range. Simple steps. Often overlooked.
No kit removes the need for validation. Some compounds may affect color development or cell metabolism independently of cell number, so results can require an orthogonal method. That limitation deserves attention, even when the signal looks convincing. The comparisons here are intended to help researchers make a more informed shortlist; they are not a substitute for checking current product specifications or testing a kit with the cells and conditions actually being used.
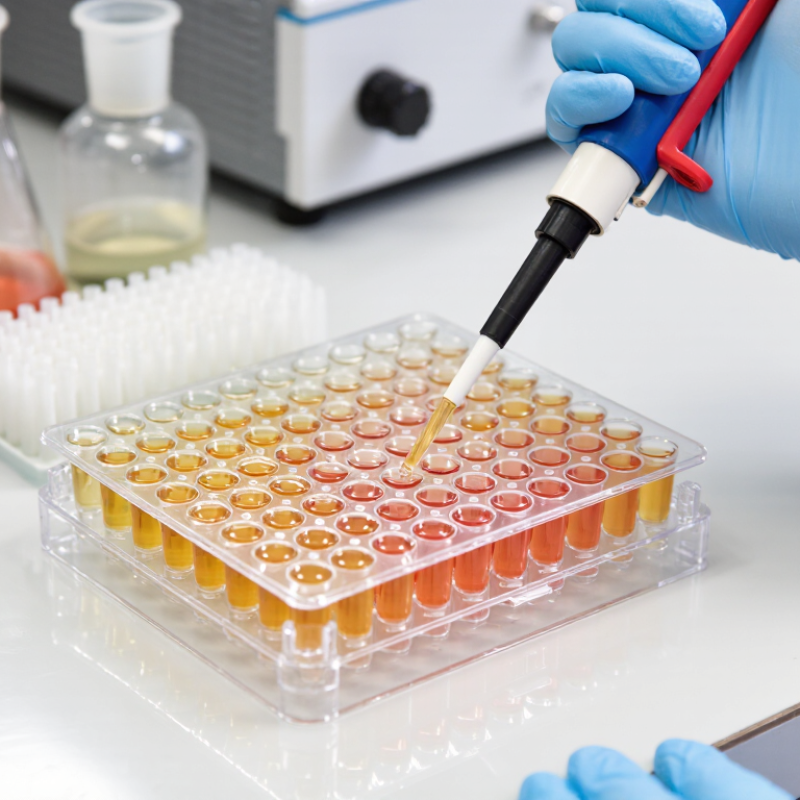
CCK-8 Assay Principle: WST-8 Formazan Is Measured at 450 nm
CCK-8 assays estimate cell viability through a color change linked to cellular metabolic activity. In the reagent, WST-8 is reduced by dehydrogenase activity in metabolically active cells. This reaction forms an orange, water-soluble formazan product. More active cells generally produce a stronger signal.
The key measurement is absorbance at 450 nm, read with a microplate reader. Keep the wavelength consistent, and include cell-free wells to measure background from the medium and reagent. Small details matter.
Uneven cell distribution, bubbles, or long delays before reading can affect results. Run a cell-number series to check that absorbance remains within the assay’s linear range. This step is easy to skip, but dense cultures may give misleading comparisons.
Also consider whether a test compound absorbs light or changes cellular metabolism directly. The signal reflects metabolic activity, not cell number alone. I have seen that distinction blur interpretation, especially when stressed cells remain alive but change their metabolism. A CCK-8 result is useful, though it still needs context from the experiment.
Kit Selection: Compare 450-nm Readout, Plate Format, and Shelf Life
When comparing CCK-8 assay kits, check that the protocol specifies absorbance measurement near 450 nm. The colored product is water-soluble, so the assay generally avoids a separate dissolution step. Confirm that your plate reader has a suitable filter and that the recommended incubation time fits your cell type. Small details matter. Include blank wells with medium and reagent, since background absorbance can affect low-signal samples.
Plate format changes more than the number of samples. A 96-well plate is often easier for initial optimization and pipetting, while a 384-well plate can reduce reagent use. However, smaller volumes may increase sensitivity to evaporation and dispensing variation. Not always. Check the kit’s stated working volume, plate compatibility, and whether your reader supports the chosen format. Avoid comparing results across formats without testing them side by side.
Shelf life depends on the kit’s labeled storage conditions, not just the printed expiry date. Review the insert for storage temperature, light protection, and any limits on opened components. Record receipt and opening dates, and avoid repeated temperature changes where the instructions advise against them. A practical check is to run a small control plate before a large experiment. It may feel like extra work, but it can reveal weak signal or elevated background before valuable samples are used.
Top CCK-8 Assay Kits for Cell Viability Testing - Kit Selection: Compare 450-nm Readout, Plate Format, and Shelf Life
| Selection option | Best suited for | 450-nm readout | Plate format and workflow | Starting reagent guidance | Shelf life and storage check |
| Standard screening setup | Routine viability and proliferation assays with moderate sample numbers | Measure absorbance at 450 nm using a compatible microplate reader | 96-well plates; convenient for replicates and multiple treatment groups | A common starting point is 10 µL reagent per 100 µL culture medium; optimize for the cell type and protocol | Check the lot-specific expiry date and storage instructions on the kit label or insert |
| Higher-throughput setup | Large compound screens or experiments with many conditions | 450-nm absorbance; confirm the reader supports the selected plate format | 384-well plates; lower volumes can reduce reagent use but require careful dispensing and mixing | Scale reagent volume to the culture volume and follow the assay instructions; validate signal and edge-well effects | Shelf life is lot- and product-specific; do not estimate it from plate format |
| Low-throughput or larger-volume setup | Experiments needing larger culture volumes or easier handling of adherent cells | The reaction can be read at 450 nm; transfer an aliquot to a compatible reading plate if needed | 24-well plates; suitable for larger cultures, but check reader compatibility before measuring directly | Use the protocol’s recommended reagent-to-medium ratio and ensure the aliquot is representative | Follow the printed expiration date and specified storage temperature; protect the reagent from light when instructed |
| General assay considerations | Comparing results across cell types, treatment groups, or assay days | Use blank wells to correct for medium and reagent background; keep read settings consistent | Choose a plate that fits the reader and provides an appropriate number of replicates | Incubation time and reagent amount depend on cell density and metabolic activity; establish a linear signal range | Use the kit insert for storage and expiration details; avoid using expired or improperly stored reagent |
Note: CCK-8 results reflect cellular metabolic activity and are commonly used as an indicator of viable cell number. Recommended volumes, incubation times, storage conditions, and shelf life vary by kit and lot; confirm them in the supplied instructions.
Plate Setup: A Common Protocol Adds 10 µL Reagent to 100 µL Medium
In a 96-well plate, the common setup is 100 µL of cell-containing medium plus 10 µL of CCK-8 reagent. That makes 110 µL total per well. Keep volumes consistent across samples, blanks, and controls; even small differences can affect absorbance. Include cell-free wells with medium and reagent to measure background. Mix gently, avoiding bubbles near the optical path. Incubate for the same duration across the plate, then read absorbance near 450 nm, as described for water-soluble tetrazolium assays by Tominaga et al. (1999). Timing matters.
The 10 µL addition is a practical starting ratio, not a universal rule. Cell density, medium composition, and incubation time can shift the signal. A pilot plate with several cell densities helps confirm that readings remain proportional to cell number. Edge wells may behave differently as temperature and evaporation vary; I still find them imperfect, so use them as buffer wells when possible. The ISO 10993-5:2009 standard identifies a viability reduction greater than 30% as an indicator of cytotoxicity, but that threshold belongs to a defined testing context. It should not replace assay-specific controls or validation. Record reagent volume, incubation time, and plate position with each run.
Signal Development: Typical CCK-8 Incubation Takes 1–4 Hours
CCK-8 assays use a color change to estimate viable, metabolically active cells. After adding the reagent, WST-8 is converted into a soluble colored product. Its signal is commonly measured near 450 nm. Timing matters. Many protocols use a one-to-four-hour incubation, but this range is a guide, not a fixed rule. Cell type, seeding density, and metabolic activity can all affect how quickly the signal develops.
For a practical starting point, check the plate after one hour, then at regular intervals if the color remains faint. A dense well may develop a strong signal sooner than a sparsely seeded one. Small differences count. Keep incubation times consistent across treatment and control wells, and avoid letting some plates sit longer while others are read. Not always. Extending incubation can increase absorbance, but an overly strong signal may fall outside the reader’s linear range. Compare readings with a blank and confirm the chosen time using a cell-number series. CCK-8 reflects metabolic activity, not a direct cell count, so stressed cells may produce unexpected readings. The four-hour endpoint is not automatically better; the clearest usable signal is the goal.
Data Quality: Verify Cell-Density Linearity with Blank and Vehicle Controls
A CCK-8 signal is useful only when cell number and absorbance stay aligned across the working range. Seed a short density series, such as 1,000 to 16,000 cells per well, and measure it after the same incubation time planned for the experiment. Keep medium volume, edge-well handling, and reagent exposure consistent. Plot absorbance against seeded cell number; a curve that bends at the upper end warns that the assay may be saturated. Check the range again for each cell type. Different growth rates can shift it.
Use two controls on every plate. Blank wells contain medium and CCK-8 reagent but no cells, revealing background absorbance. Vehicle controls contain cells and the same solvent concentration used in treated wells. A vehicle can affect metabolism even when it looks harmless. Compare its signal with untreated cells before interpreting compound effects. NIH’s Assay Guidance Manual recommends assay controls and performance checks, while Zhang, Chung, and Oldenburg’s 1999 Journal of Biomolecular Screening paper established the Z′ factor as a measure of screening-window quality; values above 0.5 are commonly considered suitable for robust assays. That benchmark does not replace a cell-density curve. Small practical details matter. I have seen a tidy mean hide a weak edge-well pattern, so inspect replicate values and plate position, not just the summary. Cite: Assay Guidance Manual, NCBI Bookshelf; Zhang et al., J Biomol Screen, 1999;4(2):67–73.